What is Epigrep?
Grep is good at lines. Epigrep is for sequences.
Epigrep finds temporal patterns in partitioned, timestamped event sequences. Where grep matches a line and SQL matches a row, Epigrep matches an ordered sequence of events that unfolds over time, within one partition, inside a time budget, optionally with a clause saying what must not happen in between.
The same idea works whether your events are parcels or pods. Here it is both ways.
A parcel that didn't arrive cleanly
Think of a courier's tracking history — a sequence of events, grouped by parcel, in time order:
Parcel 7Q   Mon 09:14   dispatched
Parcel 7Q   Tue 11:02   out_for_delivery
Parcel 7Q   Tue 17:40   failed_attempt      (nobody home)
Parcel 7Q   Wed 12:20   delivered
Parcel 3B   Mon 16:30   dispatched
Parcel 3B   Tue 10:15   out_for_delivery
Parcel 3B   Tue 13:05   delivered
You want the parcels that went out for delivery and then arrived, with no failed attempt in between — a clean first-time delivery, per parcel:
pattern = (
    Pattern.event("out_for_delivery")
    .then("delivered", no="failed_attempt")
    .build()
)
Epigrep returns parcel 3B as a match. Parcel 7Q is a near-miss: it did
eventually arrive, but a failed_attempt sits between the two steps, so the
"no failed attempt" clause rules it out — and Epigrep tells you that is why. No
order-by, no self-join, no manual grouping.
The same shape in your logs
Operational logs are the case Epigrep leads with: it is where grep and SQL hurt most, and where most people will reach for it first. The machinery is the same; here the events are structured log lines, grouped by pod instead of by parcel:
09:00:00   api-1   config_reload
09:01:30   api-1   oom_killed
09:00:00   api-0   config_reload
09:00:30   api-0   readiness_success
09:01:10   api-0   oom_killed
The question — config reload, then an OOM within two minutes, with no readiness
success in between, per pod — is painful in grep (no order, no windows),
awkward in SQL (self-joins and NOT EXISTS per gap), and fiddly in pandas. In
Epigrep it is the same two-step pattern as the parcel:
pattern = (
    Pattern.event("config_reload")
    .then("oom_killed", within=120, no="readiness_success")
    .build()
)
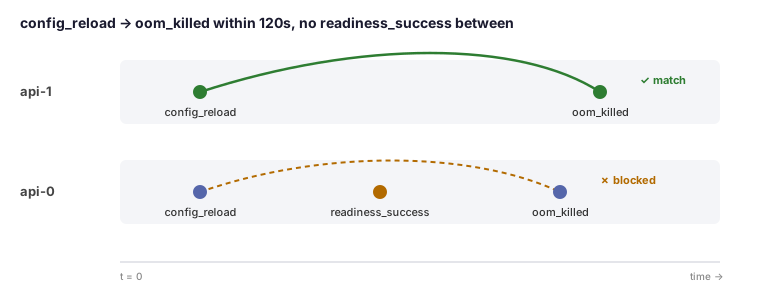
api-1 matches. api-0 is a near-miss — a readiness_success lands between the
reload and the OOM, so the process recovered and it is not the failure we are
hunting.
What you get back
For each start position Epigrep tells you one of two things:
- a match — the participating event indices, the span (start and end timestamps), and any captured attribute values; or
- a near-miss explanation — for starts that cannot complete, the deepest partial path it reached and the reason the next step failed (a predicate, a blocking event, an exceeded window, or simply no successor).
The explanation is the part that is hard to get from grep, SQL, or pandas: not just that something did not match, but why.
How it works
- The semantics are written down and tested, not implied by the code. A naive reference matcher is the source of truth, and a second, independent implementation is checked against it by property tests.
- A small Rust core does the matching; a Python API is the surface.
- Patterns are built with a Python builder or a stable JSON format; the text DSL is experimental.
Where next
- Getting started — build it and run your first match.
- Events and partitions — the input model.
- Patterns — how to express what you are looking for.
- Semantics — exactly what a match and a non-match mean.
- Explanations — near-misses and what they do and do not promise.
- Logs-first recipes — worked observability examples.
- Limitations — the boundaries of the 0.1 release.
Status
Alpha (0.2.0). Published to PyPI — pip install epigrep. The Python API and
JSON pattern format are the intended stable surface; the text DSL is
experimental.